Demographics
The original inhabitants of Zambia were the Khoisan people. The region was eventually colonized during a Bantu expansion in the 13th century. There are now 72 ethnic groups in Zambia.1
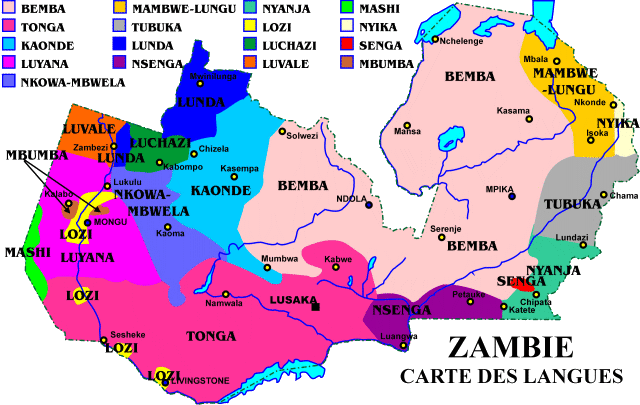
Nearly 90% of Zambians belong to one of 9 ethnolinguistic groups: Nyanja-Chewa, Bemba, Tonga, Tumbuka, Lunda, Luvale, Kaonde, Lozi, and Nkoya.
Expatriates, most of which are from South Africa and the United Kingdom, are mostly in Lusaka and the Copperbelt. While there were 70,000 Europeans in the country in 1964, most have left. It is estimated that there are still 40,000 Europeans. There is also a small population of 80,000 Indians and 13,000 Chinese.
There are about 89,000 asylum seekers and refugees in Zambia, most of which came from the Democratic Republic of Congo (47,000), Angola (27,000), Zimbabwe (5,000) and Rwanda (5,000).2
Population Factsheets3
- 2018 population: 17,609,178
- 2018 Population Growth Rate: 0.23% of the total world population
- 2018 Urban population: 41.1% (7,239,024) one of the most urbanised countries in sub-Saharan Africa
- Population rank: 66th
- Population density: 24 per Km2 (61 people per mi2) While it is the 30th largest country, Zambia is not very densely populated, which ranks 191st in the world
- Capital population: 2,500,000
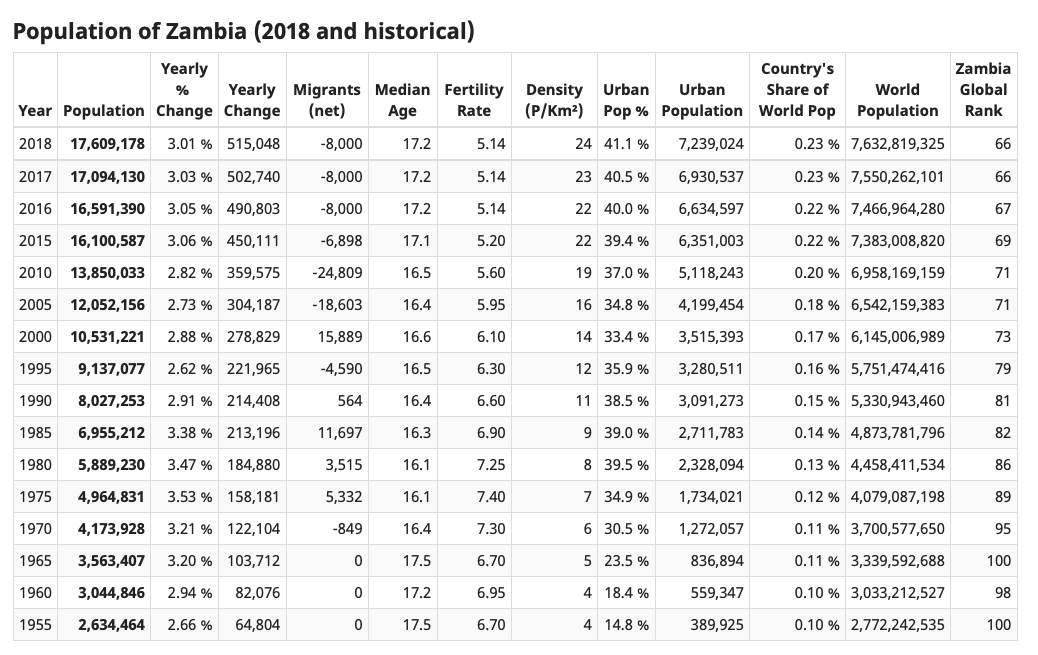
Figure 1 shows the population of Zambia (2018 and historical)
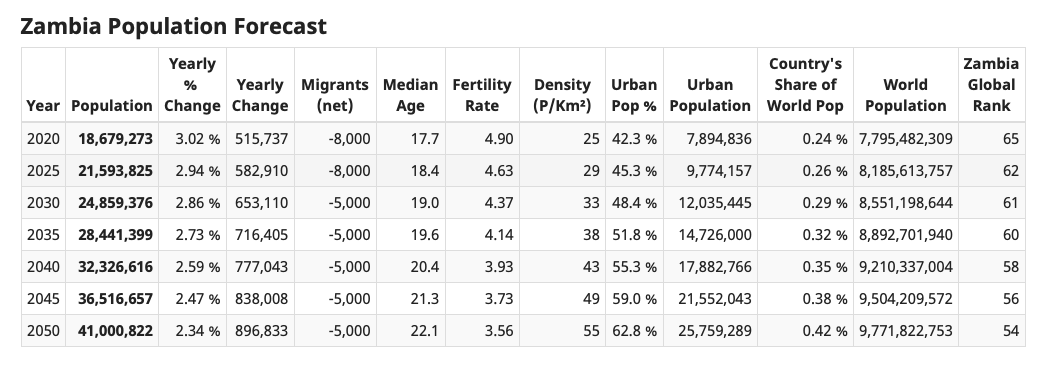
Figure 2 shows the Zambia population forecast (2020-2050)
- The population in 2050 will be more than double than that in 2020.
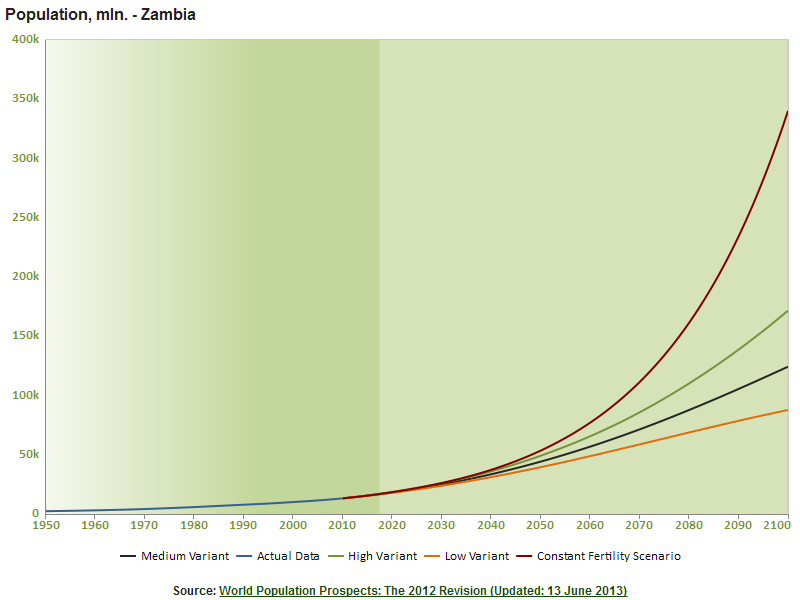
Figure 3 shows the Zambia population growth and forecast(1950-2100)
Age structure4
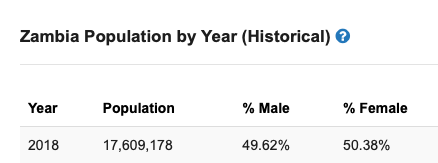
Figure 4 shows the percentage of male and female in Zambia population
- The number of female is more than male.
- Sex ratio is 1.01
(9,014,272 men to 8,968,444 women).
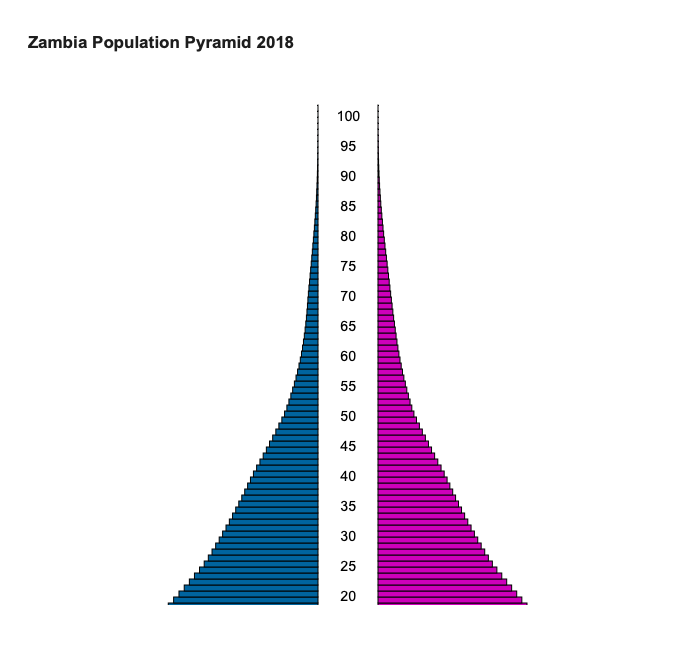
The population is expanding, with high birth and death rate. It is common in developing countries.
- 46.7% of population under 15 years old
- 50.8% percentage of population between 15 and 64 years old
- 2.5% of population 65+
The dependency ratio(non-workforce group) is 96.8%. Pressure on productive population in Zambia is very high.
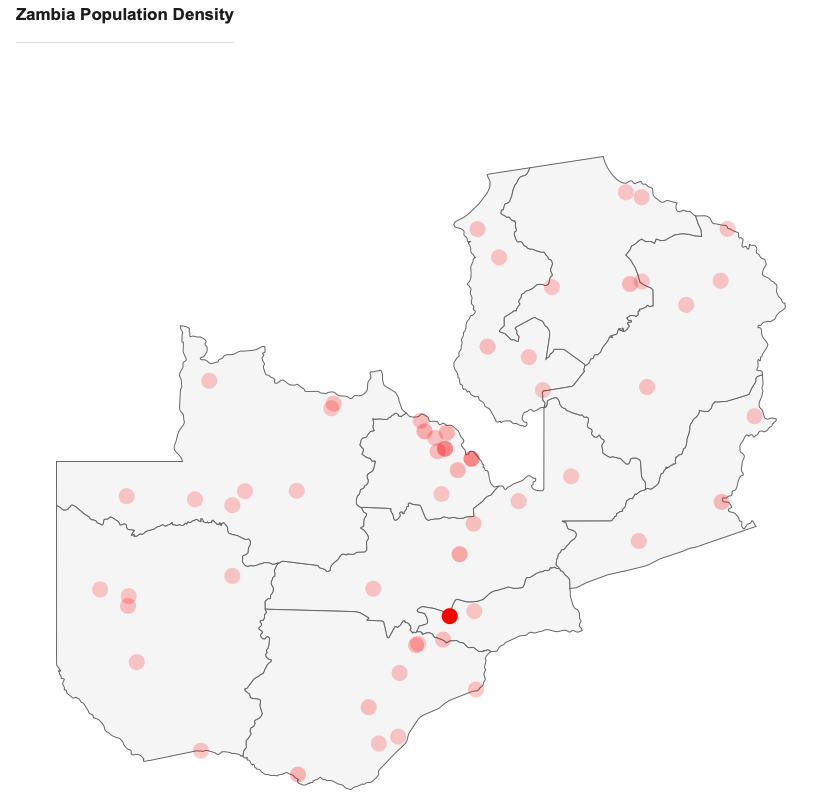
Figure 6 shows the population density
Zambia population clock
Reference:
1-3. Central Statistical Office Zambia (2018). . Retrieved from, Central Statistical Office Zambia Web site: https://www.zamstats.gov.zm
4. Countrymeters (2018). Zambia Population clock. Retrieved from, Web site: https://countrymeters.info/en/Zambia
